Threshold
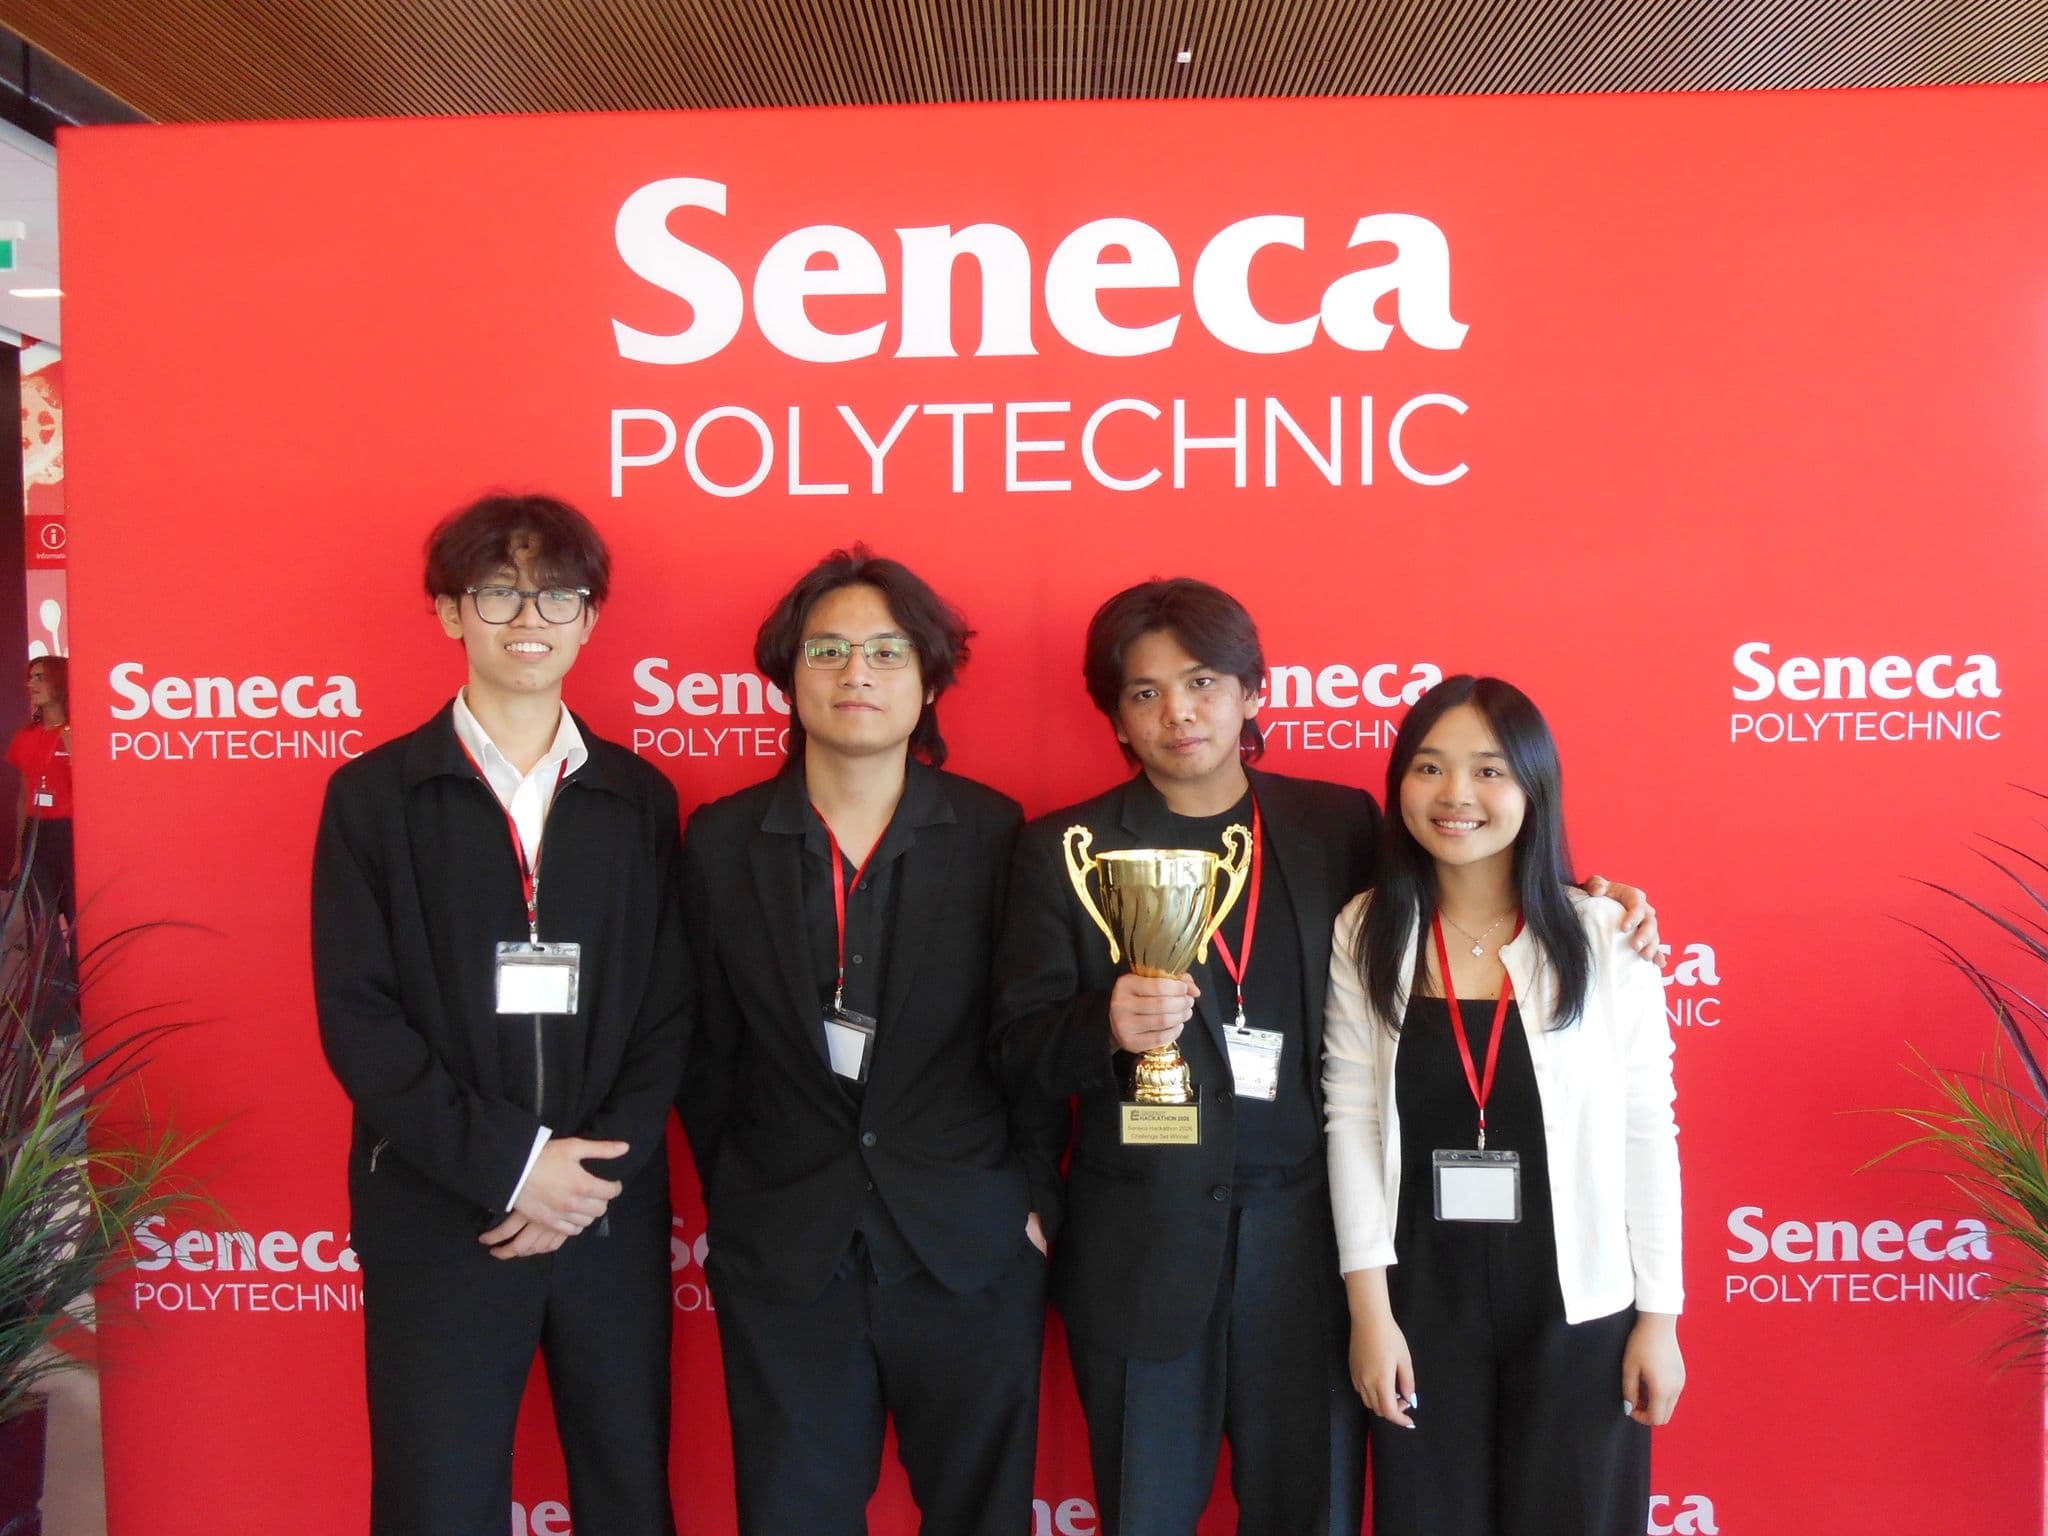
Seneca Energy Hackathon 2026
1stplace
Threshold is a civic data platform for community energy vulnerability: public datasets and live signals fused into a map with scores, source citations, and recommended actions.
- Public data feeds fused into one model
- 9Public data feeds fused into one model
- Brampton census tracts scored
- 122Brampton census tracts scored
- Scenarios: baseline, heatwave, ice storm
- 3Scenarios: baseline, heatwave, ice storm
- Clicks from a map colour to its evidence
- ≤2Clicks from a map colour to its evidence
Utility, city, climate, and census data never meet in one place.
Energy vulnerability data is spread across utility feeds, municipal open data, climate sources, and census datasets. Emergency managers and utility planners do not need another dashboard; they need to see where vulnerability is concentrated, why, and what to do next.
Every recommendation traces to a number; every number traces to a public dataset.
We pulled structural, seasonal, and live signals from Alectra, Brampton open data, Esri, Statistics Canada, Open-Meteo, and Environment Canada, and normalized them into census-tract communities, facilities, weather cells, outages, and advisories.
We scored each community under baseline, heatwave, and ice storm scenarios and laid outage, weather, flood, and advisory layers on top, then ranked recommendations by projected impact, cost, and confidence. Gemini writes the plain-language briefing around the evidence, with deterministic fallbacks; the model never produces the numbers.
All 122 tracts scored for the demo.
The frontend is React and TypeScript on Vite with Leaflet. The backend is FastAPI, and a Postgres pipeline moves data through raw, staging, curated, ml, and public layers.